


Self-Service Analytics: how to get instant insights on Haystack
For anyone working with large amounts of IoT data, I generally recommend data modelling standards like Project Haystack. It streamlines how you work with IoT and building data while also ensuring interoperability. But unfortunately, not everyone has the skill or resources to script their next smart building data insight.
In this post, I’ll show you how we’ve taken a query language from Facebook to create a new interface that allows anyone to build insights on Haystack data in a few clicks.
Project Haystack
Project Haystack is an open-source initiative that I highly recommend to anyone considering a new smart building or energy monitoring solution. This popular open-source initiative offers leading solutions in two key areas:
- Community driven standards for structuring your data with tagging. The context surrounding your information is captured via standardised tags, making it vastly easier to manage.
- A standardised method for exchanging data via a REST API that improves interoperability and eases integration headaches for 3rd parties.
With excellent developer support, the Haystack API is a must-have to ensure interoperability. However, I wouldn’t recommend its use exclusively. One main drawback is its time-series data handling. Anyone wanting to build an insight is required to copy all the raw data into 3rd party software or spreadsheet and perform the calculation themselves. This no-frills API limits ad-hoc analysis and is something we’ve recently addressed in WideSky Cloud that allows customers to ask data questions directly from their browser. To power this new analytical feature, we used a technology called GraphQL.
What is GraphQL?
While you might think the ‘QL’ in GraphQL means its a query language for graph databases, it’s more accurate to think of GraphQL as a query language for APIs. Developed internally and eventually open-sourced by Facebook in 2015, tech companies have taken to it quickly to streamline how clients can communicate with servers.
To use GraphQL, a user submits a query structured with precisely what they want in a single request, and the server responds with the data in the same structure. You ‘ask for what you need’, and ‘get exactly that’ while avoiding any looping in code.
See this example below in a GraphQL query tool:
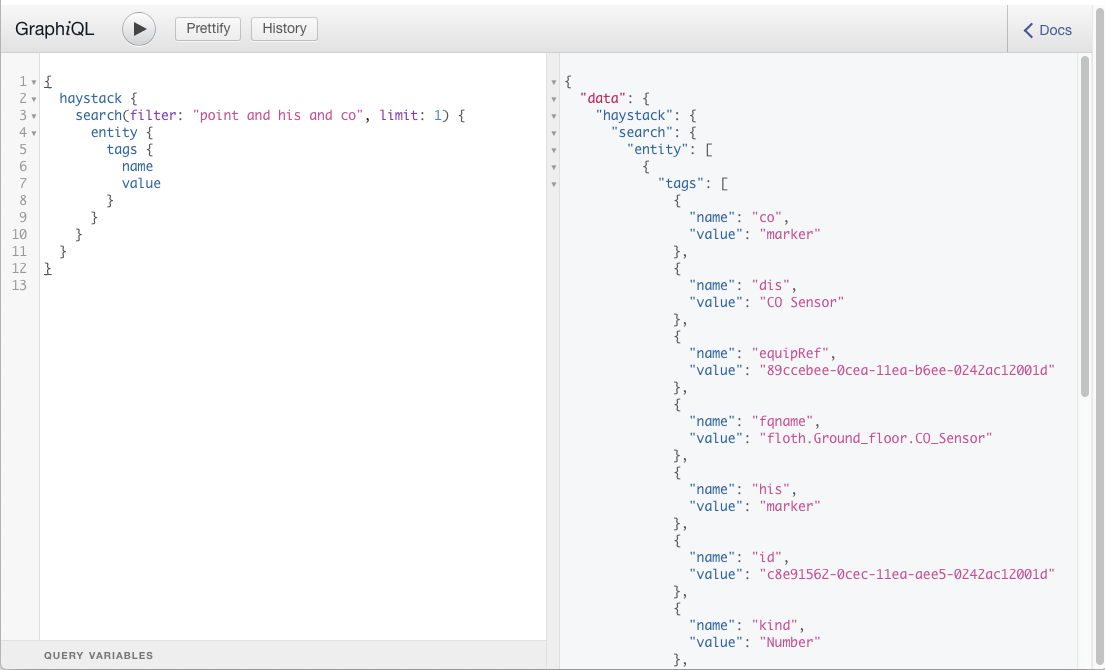
Now while you might say, ‘That is still scripting!’ you’d be right. Fortunately, we took it a step further and built a clickable interface in our favourite vis tool Grafana. Here anyone can create insights in a few mouse clicks instead of having to worry about syntax errors.
Here is a screenshot of how you build the same query in a Grafana dashboard:
Note: This Grafana dashboard edit view places the visualisation (in this case, a table) in the top half and the query at the bottom half.
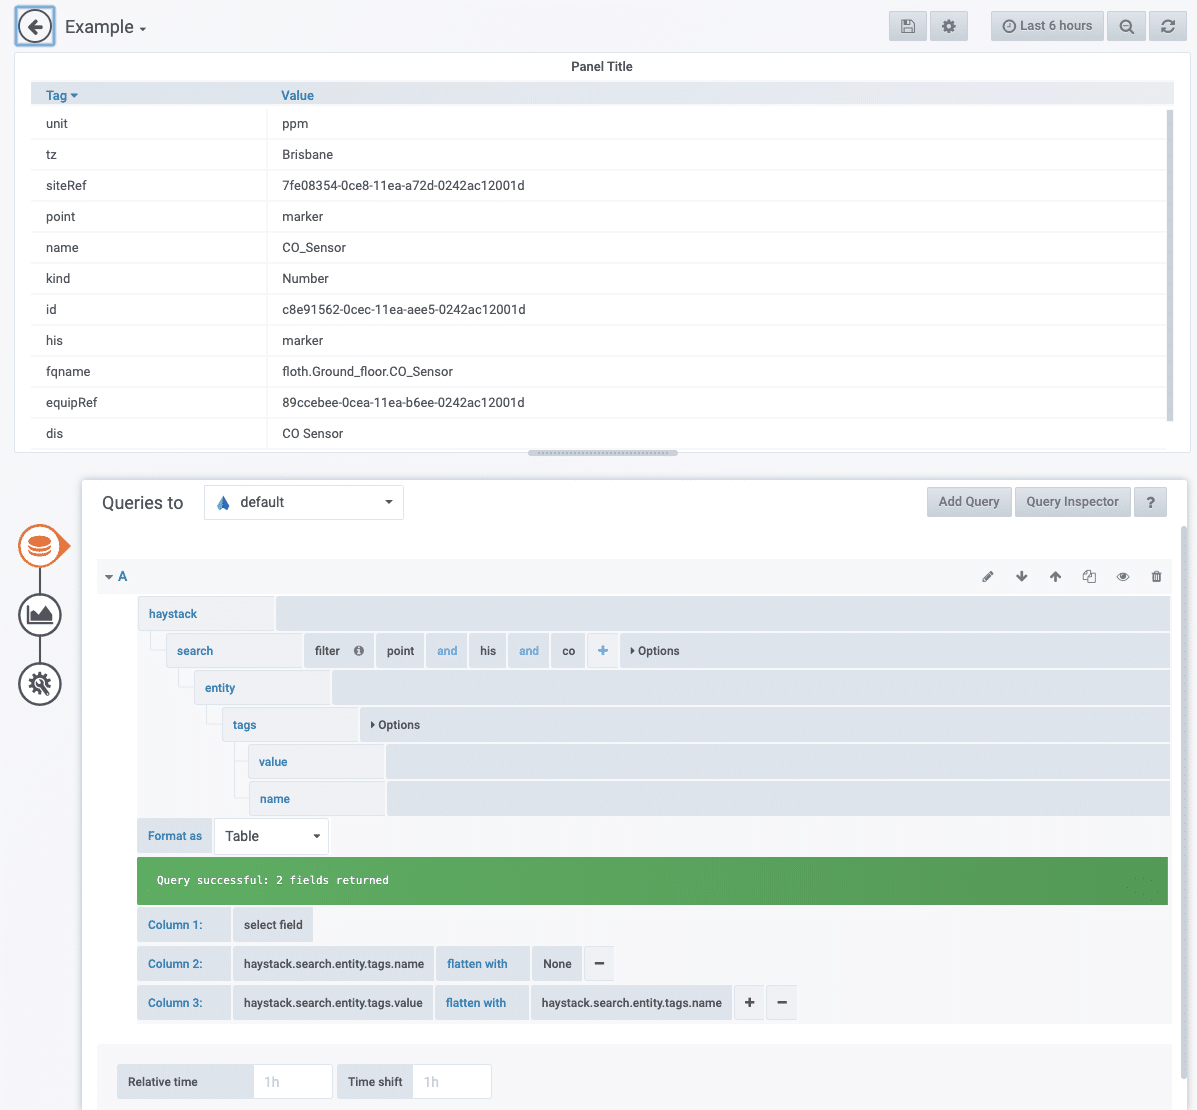
Every element in the query builder is clickable with built-in helper suggestions making it’s easy to use. Dashboards become a breeze to create and share as you can focus on the insights rather than how to code them up.
If you’ve had experience in other data science fields, you may be thinking: ‘Why didn’t you use, SPARQL / OData / a scripting language / (other data science tool) instead?’. There are plenty out there, and while we evaluated most of them, we kept coming back to our ease of use goal and found that with its focus on simplicity, GraphQL is a perfect fit.
Living Lab Example
Let’s get right to it with a simple building energy monitoring example while comparing against the Haystack API.
Our WideSky office has a range of fun IoT toys and smart building devices we use to demonstrate WideSky capabilities in our Living Lab. In this example, we’ll use the energy meters that report to WideSky.
Question: What was yesterdays average power consumption for each electrical meter, in each area of WideSky Living Lab?
Old Way: Via the Haystack API, we have to write a script, and because we don’t know the name of the entities upfront, we have to loop through to discover them. For example, we’d search for spaces followed by points with elec and power tags. Finally, for the matching entities, we query all the raw data for yesterday and perform the averaging calculation ourselves.
New Way: With GraphQL, it’s incredibly easy. We create a single request to match the nested query for spaces and points and ask WideSky to calculate the average for us. We only have to display the results.
The illustration below highlights the two approaches:

The screenshot below shows the completed example in Grafana:
Note: This Grafana dashboard edit view places the visualisation (in this case, a table) in the top half and the query at the bottom half.
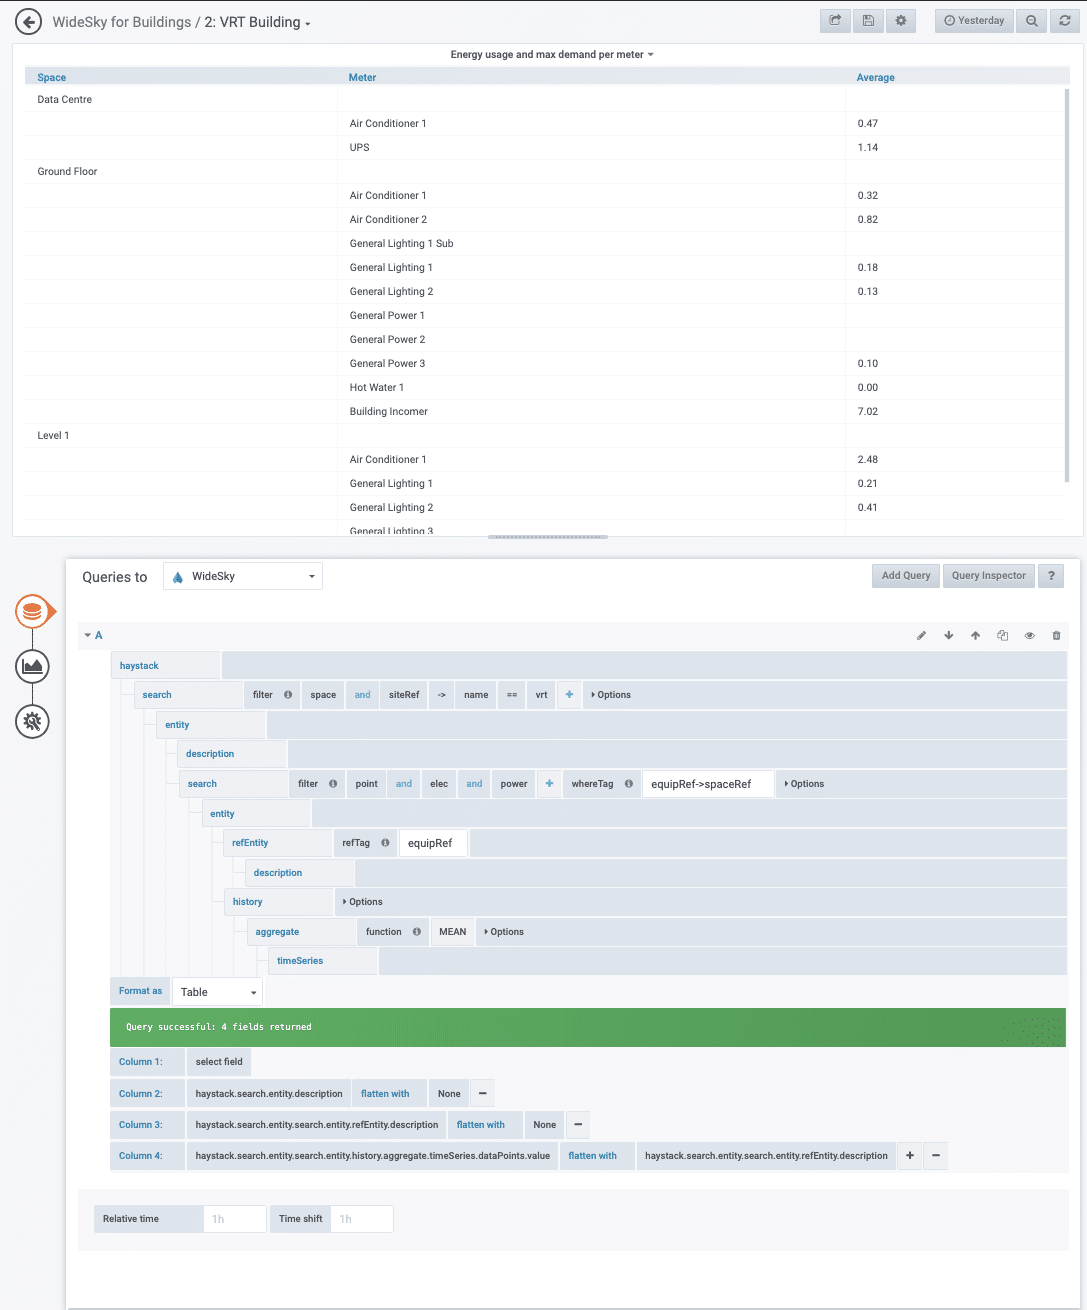
Notice how we’re able to search for entities recursively? What would have taken 24 HTTP exchanges using the Haystack API is now 1 with a GraphQL query. This nesting capability allows us to create powerful model walks, giving you the freedom to explore any way you like. The calculations are also fast; this example returns in 82ms.
Conclusion
GraphQL streamlines interacting with Haystack and IoT data. Combined with a clickable interface in Grafana, anyone can work with Haystack data. No more asking your dev team or data wrangler to create that report for you. You can also leverage the valuable investment in implementing Haystack tagging as domain specialists who may not be the best data-wrangler can now build insights themselves. With WideSky’s Self-Service Analytics, you can get back to finding the value in your data instantly – by yourself.